4. EXPERIMENTAL PROCEDUCE
4.1. Practice 1:Determination of the characteristic curve of the pump.
Objective
Our goal in this practice is to obtain the characteristic curve of the pump.
So it's the relationship between the number of revolutions , the height of elevation (H), power (P) and flow (G).
Introduction
In this case, the liquid is distributed as the scheme presented below:
Where:
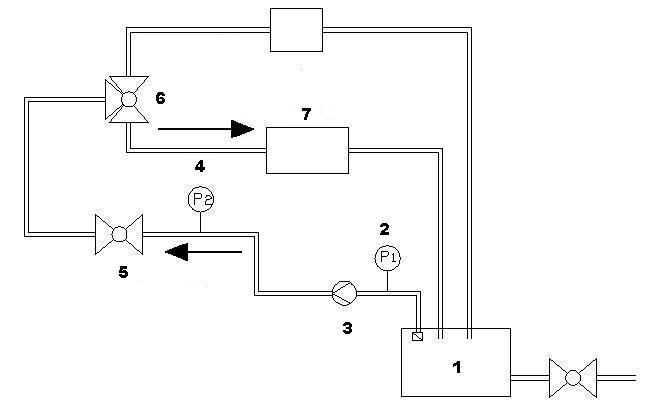
1) Water tank.
2) Manometer (P1).
3) Pump.
4) Manometer (P2).
5) Valve.
6) Spherical valve of three way.
7) Diaphragm.
Material
In this case we only need the pilot plant.
Procedure
To carry out this practice, you must follow these steps:
1.Observe the level water of the tank (1), is 10 cm from the surface.
2. Watch it is plugged.
3. Remove the emergency stop (a).
4. Put the device in position "ON" with the red wheel (b).
5. Before turning on the pump, check spherical valve of three way (6) is closed (position "OFF").
6. Press the Power button (c).
7. Opening the spherical valve of three way (6)
8. With the wheel of potentiometer (f), put the equipment at 2400 rpm, you must do it gradually, not abruptly.
9. Open up the valve (5) which is under the manometer.
10. Connect two hoses of pressure sensor to diaphragm (7). If we not get any value in the screen flow, is that they are bad connected, therefore exchanging the position.
11. Purge (II) air to the pipes opening the purge valve.
12. Note the flow (d), power (h), the angular velocity (g), strength (e) and two pressures (P1 and P2) given by the two manometers.
13. Keep ω, and close a little the valve below the gauge (we variant P2). Back to annotate the data described above.
14. Repeat the operation ranged from P2 until the valve is fully closed (it will be time to end the practice.)
15. Once practice is finished, put spherical valve of three way (6) in position "OFF".
16. Stop the machine, with the stop button (c) the wheel and red (b).
17. Pressing the emergency stop (a).
Below there is the video as how is done in practice:
Expression of result
To express the results, you should use a table type:
ω (rpm) |
P1 (bar) |
P2 (bar) |
G (m3/h) |
Power (W) |
F (N·m) |
u1 (m/s) |
u2 (m/s) |
H (m) |
Pmec (W) |
Phyd (W) |
η (%) |
2400 |
|
|
|
|
|
|
|
|
|
|
|
2400 |
|
|
|
|
|
|
|
|
|
|
|
2400 |
|
|
|
|
|
|
|
|
|
|
|
2400 |
|
|
|
|
|
|
|
|
|
|
|
2400 |
|
|
|
|
|
|
|
|
|
|
|
2400 |
|
|
|
|
|
|
|
|
|
|
|
2400 |
|
|
|
|
|
|
|
|
|
|
|
2400 |
|
|
|
|
|
|
|
|
|
|
|
2400 |
|
|
|
|
|
|
|
|
|
|
|
2400 |
|
|
|
|
|
|
|
|
|
|
|
2400 |
|
|
|
|
|
|
|
|
|
|
|
2400 |
|
|
|
|
|
|
|
|
|
|
|
2400 |
|
|
|
|
|
|
|
|
|
|
|
2400 |
|
|
|
|
|
|
|
|
|
|
|
Once we complete the results table, we do the characteristic curve in a graph. So, we will put the height (H) in the axis of abcisses, and the flow (G) axis of the order, as shown in the figure:

We look that as volumetric flow increase (G), the height decrease.
This effect is due to the pressure difference between P1 i P2, which is related to the height (H). Therefore, the greater the pressure difference over the height decreases, as shown in the formula provided for in section theoretical.